

table of contents
A single doctor average salary figure can mislead a practice manager faster than it informs one. The headline number for physicians is $386,000 in 2026 according to White Coat Investor's compensation summary, but that number hides the operational reality underneath compensation: specialty mix, market geography, payer contracts, coding complexity, and collections discipline.
For healthcare leaders, salary data isn't just labor market trivia. It's a planning tool. If compensation is one of your largest costs, then every staffing model, payer strategy, coding workflow, and accounts receivable process affects whether your group can fund competitive offers and retain productive physicians without squeezing margins.
Understanding The 2026 Doctor Average Salary
Compensation planning breaks down when a practice treats one national benchmark as a budgeting answer instead of a starting assumption. As noted earlier, physician pay in 2026 spans a wide range by role type, with primary care and specialist compensation sitting far enough apart to change staffing models, recruiting timelines, and margin expectations for the same organization.
For practice managers, that spread has direct financial consequences. A higher-paying specialty usually brings more coding complexity, different payer behavior, and greater exposure to denials or underpayments. If the billing operation cannot convert documented work into collected revenue with consistency, the practice may advertise market-level compensation but struggle to sustain it after the physician is hired.
Salary benchmarks work best as operating inputs. They help set offer ranges, forecast provider cost per FTE, and test whether projected collections can support guaranteed pay plus incentives.
Why One Average Doesn't Help With Budgeting
A family medicine clinic, an orthopedic group, and a multispecialty organization all employ physicians, but they do not buy labor from the same market. Their economics differ because reimbursement levels, visit patterns, procedure mix, and documentation demands differ.
That distinction matters at budget time.
A compensation figure without context can push a practice into two costly errors. It can lead leaders to under-budget physician expense and lose candidates to stronger offers. It can also lead them to overcommit on guarantees before confirming whether payer contracts, coding performance, and collection rates can fund the package. In both cases, the salary benchmark was not wrong. The practice used the wrong benchmark for its operating model.
Salary data becomes useful only after it is paired with payer mix, denial rates, coding accuracy, physician productivity, and the time it takes the practice to turn charges into cash.
The Better Question For Practice Managers
A stronger compensation discussion starts with narrower questions tied to the practice's finances:
- Which benchmark matches our specialty mix: Compensation targets should reflect the actual physicians the group plans to recruit, not a blended national figure.
- Which labor market are we hiring in: Local competition affects sign-on packages, guaranteed salary periods, and retention risk.
- What collection performance is required to support this offer: Physician pay is funded by net collections, so weak revenue cycle performance limits compensation flexibility.
This framing changes how salary data is used. Instead of serving as trivia for candidates, it becomes a planning tool for physician recruiting, budgeting, and retention. It also exposes a point many compensation roundups miss. The ability to pay competitively depends not only on market rates, but on how efficiently the practice captures, submits, and collects revenue.
Deconstructing The National Average Salary Figures
A single national pay figure can distort hiring decisions faster than it helps them. Practice managers who treat one blended benchmark as a target often miss the distribution underneath it, and that is where compensation planning either stays disciplined or starts drifting away from what the practice can fund.

Mean And Median Aren't The Same Decision Tool
The mean combines all reported physician compensation and divides it across the sample. The median marks the midpoint of the distribution. Those measures answer different management questions.
For recruiting, the median is often the safer reference point because it reduces the influence of unusually high earners, owner distributions, and outlier incentive packages. For budgeting, the mean still matters because it helps estimate aggregate labor expense across a provider group. A practice that confuses those uses can set offers too high for its cash flow or too low for its market.
A simple example shows the risk. In a five-physician group, one highly paid proceduralist can pull the mean up enough to make every employed primary care offer look under market or over budget, depending on which side of the equation leadership sees first.
The Limits Of The National Baseline
A national average is a broad market signal. It is not a compensation recommendation.
It can show that physician labor remains one of the largest expense categories in a medical practice. It cannot tell a multisite group what guarantee to offer in a specific specialty, under a specific payer mix, with a specific denial profile and lag in collections. That distinction matters because compensation is paid from collected revenue, not from benchmark tables.
This is especially clear in service lines where reimbursement is sensitive to authorization, coding specificity, and follow-up discipline. Behavioral health groups, for example, can review mental health revenue cycle management workflows to see how front-end errors and claims delays directly restrict compensation flexibility even when market demand for clinicians is strong.
How To Read Salary Reports Without Mispricing Jobs
Practice managers get more value from salary data when they screen each figure through operating context:
- Identify the physician cohort: A benchmark for all physicians is too broad for a specialty-specific offer.
- Separate base pay from total compensation: Incentives, call coverage, quality bonuses, and ownership income can materially change the number.
- Check the employment model: Hospital-employed, academic, and private practice compensation structures are built on different economics.
- Test the figure against collections performance: If charge capture, denial management, and days in A/R are weak, the market rate may be accurate but still unaffordable for your practice.
Used this way, salary reports become a finance tool, not just a recruiting reference. They help leadership decide whether a compensation package fits the practice's revenue engine, and whether improving billing operations would create room for a stronger offer without increasing risk.
How Medical Specialty Dictates Earning Potential
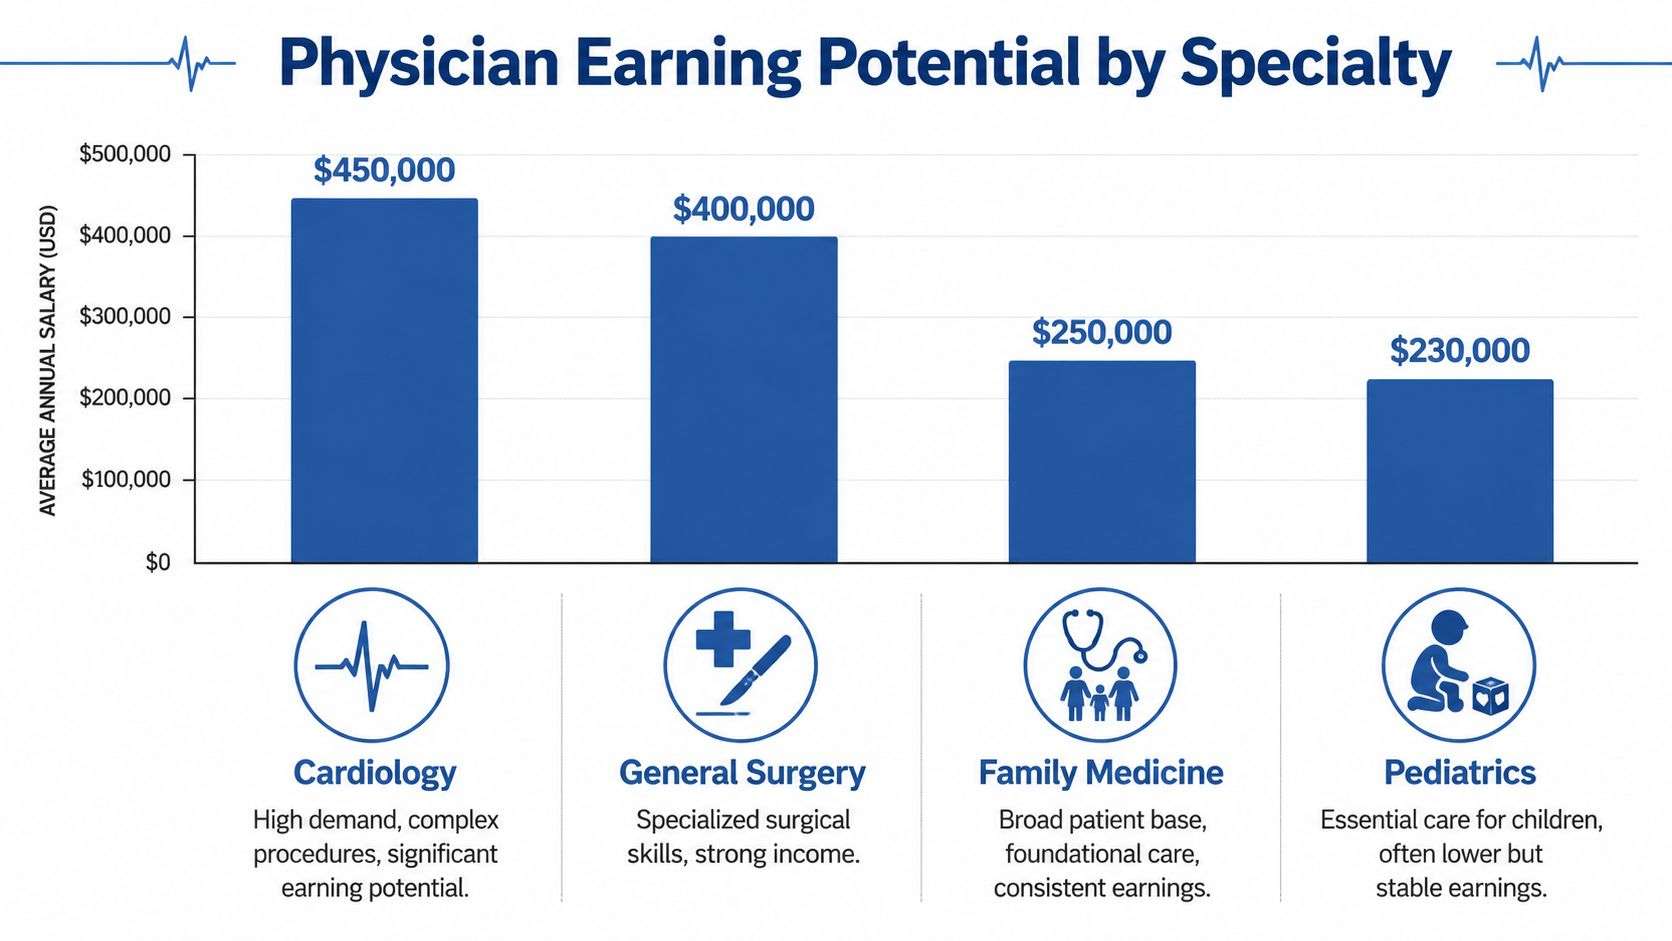
A national physician average is a weak budgeting tool if specialty mix is ignored. A cardiology hire, a family medicine hire, and a pediatric hire do not place the same demands on reimbursement, staffing, or cash flow, even when all three sit under the same physician compensation budget.
The Compensation Gap Between Primary Care And Specialists
As noted earlier, specialty benchmarks show a wide spread between primary care and specialist compensation, with procedure-heavy fields generally clustering at the top and cognitive or preventive fields lower. Cardiology and orthopedic surgery usually sit well above family medicine and pediatrics, but the management lesson goes beyond the ranking itself.
Compensation follows revenue mechanics. Specialties with higher earning potential often bill higher-acuity services, perform procedures tied to larger allowed amounts, and face tighter utilization review. Specialties with lower average pay usually depend on visit volume, disciplined scheduling, accurate coding, and fast claim turnover to protect margin.
That difference changes how a practice should set salaries. A group recruiting for gastroenterology or pain management can often justify a richer compensation structure only if charge capture, prior authorization controls, coding accuracy, and denial recovery are already working at a high level. In pediatrics or family medicine, smaller errors create margin pressure faster because the practice has less reimbursement per encounter to absorb rework.
Why The Pay Gap Exists Operationally
Three operating factors explain much of the spread in specialty compensation.
- Revenue per encounter: Procedural and intervention-based specialties usually generate more collections from each patient interaction than evaluation and management-heavy fields.
- Claim complexity: Higher-acuity specialties require more detailed documentation, cleaner coding, and tighter edits before submission.
- Payer friction: Higher-dollar claims are more likely to trigger medical necessity review, authorization disputes, or partial denials.
Practice managers should read specialty salary reports as a proxy for operational requirements. A specialty with high published pay does not automatically improve practice profitability. It may require stronger coding support, more experienced billers, better physician documentation habits, and a more aggressive appeals process before those benchmark salaries are financially realistic.
That point is especially important in multispecialty groups. Endocrinology, orthopedic surgery, and behavioral health do not share the same reimbursement logic, so they should not share a generic billing workflow. Departments with documentation-sensitive claims need specialty-specific controls, including workflows for mental health revenue cycle management when behavioral health is part of the mix.
What Practice Managers Should Take From Specialty Benchmarks
Specialty salary data is most useful when it informs operating decisions, not just offer letters.
- Compensation design should match specialty economics: Collections-based incentives work differently in procedure-driven specialties than in panel-based primary care.
- RCM staffing should follow reimbursement risk: A specialty with complex coding and frequent denials may need more backend support than a higher-headcount service line with simpler claims.
- Recruiting plans should be tested against collections capacity: If the practice cannot bill, collect, and appeal at the level the specialty requires, published market pay may be informative but still unaffordable.
The practical conclusion is simple. Specialty dictates earning potential because specialty dictates how revenue is produced, documented, and collected. Practices that treat compensation benchmarks as operating benchmarks are better positioned to recruit well and protect margin at the same time.
The Impact Of Geography And Experience On Physician Pay
A rural pay premium of 5% to 10% is meaningful, but it is rarely large enough to cover weak operations. Analysts summarized by the NEJM CareerCenter on urban versus rural physician compensation found first-year primary care guarantees of $205,588 in rural settings versus $200,000 in urban markets. For practice managers, that spread changes the planning question. The issue is not only where a physician practices. It is whether the practice can convert demand into collectible revenue fast enough to support the offer.
Oklahoma Shows Why Local Benchmarks Matter
Oklahoma is a useful example because salary benchmarks can shift materially depending on the dataset, city, and job sample behind the number. A statewide average may be directionally helpful for budgeting, but it is too blunt for setting physician guarantees across multiple sites. A group hiring in Oklahoma City, Tulsa, and smaller surrounding markets is really hiring into different reimbursement environments, labor markets, and ramp curves.
Two operational conclusions follow. First, compensation should be benchmarked at the local-market level before offers are finalized. Second, revenue assumptions should be tested with the same level of precision. If payer enrollment runs late in one location, the compensation package can look too expensive even when the underlying rate is competitive. That is why many groups tighten their credentialing process for physicians before a new hire starts seeing patients.
Published Oklahoma figures also show why managers should compare sources instead of relying on one number. One benchmark places primary care compensation in the low-to-mid $200,000 range, while other market snapshots point to meaningfully higher physician pay in Oklahoma City than in some statewide averages, as noted earlier from Salary.com and Glassdoor. The strategic point is not which single figure is "right." The point is that budgeting, payer mix, and collections performance must be aligned to the exact market where the physician will practice.
Experience Doesn't Always Move In A Straight Line
Experience matters, but pay progression is often shaped by contract structure more than by tenure alone. In Tulsa, Payscale's family physician market data, cited earlier, shows total compensation for physicians with 1 to 4 years of experience landing close to compensation for those with 10 to 19 years. That pattern suggests mature physicians are not automatically the highest-cost hires in every market.
Practice managers should read that carefully. A physician with more experience may produce stronger retention, better coding habits, or more efficient visit flow without requiring a dramatically higher guarantee. On the other hand, a younger physician on a poorly designed productivity formula can become expensive if claims lag, denials rise, or panel growth stalls. Years in practice affect pay. Collections infrastructure often determines whether that pay level is sustainable.
The better benchmarking sequence is local market first, specialty second, and experience band third. That order reflects how compensation is funded inside a practice. Salary benchmarks set the target, but operational execution determines whether the practice can carry it.
Total Compensation Versus Take-Home Pay
A large compensation package can still produce disappointing personal income. The reason is simple. Market benchmarks usually describe total compensation, while physicians judge financial reality by what reaches their bank account after taxes, benefit elections, and, in ownership models, practice overhead.
That distinction matters in recruiting and in budgeting.
A practice manager comparing offers only on headline salary can overestimate competitiveness or underestimate the operating margin required to support a physician long term. A $300,000 compensation target funded by inconsistent collections is less durable than a slightly lower package backed by clean claims, predictable cash flow, and a well-designed incentive plan.
Why Total Compensation Often Looks Larger Than Salary
As noted earlier, family medicine benchmarks can show a wide spread between base pay and total earnings. The gap usually comes from production bonuses, call coverage, quality incentives, retirement contributions, and insurance benefits. In employed models, those items can materially raise the stated package even though they do not all convert into immediate spendable income.
For practice leaders, the planning implication is straightforward. Salary surveys are useful only after each component is separated into guaranteed cash compensation, contingent earnings, and employer-paid benefits.
A physician evaluating two offers may see similar totals but very different risk profiles.
Owners Feel The Difference More Directly
In private practice, take-home pay depends on what remains after the business gets paid first. Staff wages, occupancy costs, malpractice premiums, technology subscriptions, supply expense, and billing performance all sit between gross collections and physician income. That is why two physicians with similar production can report very different personal earnings.
The operational issue is not theoretical. Every unresolved denial, undercoded encounter, or delayed claim reduces the dollars available for owner distributions and partner compensation. Groups that want to improve that spread often assess the benefits of outsourcing medical billing to reduce rework and strengthen net collections.
Reputation also affects compensation capacity. A physician can be clinically productive and still struggle to grow volume if online visibility is weak or patient reviews deter new appointments. The Review Overhaul guide for doctors is useful here because demand generation and revenue collection ultimately feed the same compensation pool.
Reported compensation is a market benchmark. Take-home pay is the residue of contract design, tax treatment, and operating discipline.
What Managers Should Separate Before Using Salary Benchmarks
Before labeling an offer competitive, break it into the parts that drive physician economics:
- Guaranteed compensation: Fixed pay that does not depend on monthly production swings
- Incentive compensation: Collections, RVU, quality, or panel-growth payments that may vary significantly
- Benefits value: Retirement match, insurance, CME support, and paid leave
- Ownership economics: The amount left after overhead and capital needs are covered
This framework leads to better recruiting conversations and better forecasts. It also surfaces a non-obvious point. Practices do not retain physicians with salary benchmarks alone. They retain them by converting production into collected revenue efficiently enough that promised compensation becomes reliable income.
How Strong RCM Directly Increases Physician Collections
Compensation doesn't originate in a spreadsheet. It comes from cash collected. That makes revenue cycle management one of the most direct levers a practice has over physician earnings, recruiting flexibility, and retention strength. If claims leave the practice with coding errors, weak documentation support, or slow follow-up, the organization shrinks the pool of revenue available to fund provider compensation.
That relationship is clearest in specialties where coding complexity and reimbursement value rise together.

Salary Benchmarks Reveal RCM Pressure Points
In Oklahoma, Internal Medicine physicians average $311,423 while Family Medicine physicians average $332,670, according to ERI's Oklahoma physician salary data. The same benchmark notes that practices with suboptimal RCM processes can experience revenue leakage of 3% to 7% annually.
That isn't a back-office inconvenience. It's money that could have supported physician compensation, technology upgrades, staffing, or debt reduction.
Where Weak Revenue Cycles Reduce Compensation Capacity
The connection between RCM and compensation usually breaks down in a few predictable places:
- Coding misses: Under-coded visits and incomplete diagnosis capture suppress reimbursement.
- Claim rejections and denials: Staff then spend time fixing preventable errors instead of accelerating cash flow.
- Slow A/R follow-up: Money that should fund payroll remains trapped in aging receivables.
- Inconsistent payer workflows: Multi-site groups often submit claims correctly in one market and inefficiently in another.
For specialty groups, this gets more expensive as reimbursement complexity increases. Higher-value claims invite more scrutiny. More scrutiny means stronger documentation, cleaner claims, and disciplined appeal management become financial requirements, not administrative preferences.
Why Clean Claims Matter For Recruiting And Retention
A practice that consistently submits accurate claims and follows unpaid balances aggressively creates a more reliable compensation environment. Physicians notice that stability quickly. It affects whether incentive plans feel credible, whether leadership can honor guarantees confidently, and whether expansion feels financially safe.
Organizations that want to tighten this link between operations and compensation often evaluate structured RCM for healthcare providers to standardize coding, claims submission, payment posting, and denial follow-up across sites.
If your collections process is weak, your compensation strategy is weak. The market may set salary expectations, but your revenue cycle determines whether those expectations are sustainable.
There's another overlooked layer here. Strong physician compensation also depends on keeping patient demand and payer trust intact. Reputation affects both. Groups trying to improve patient acquisition alongside collections may benefit from resources like this Review Overhaul guide for doctors, because online reputation influences appointment flow, and appointment flow ultimately feeds the revenue base that supports compensation.
The Strategic Conclusion
Practice leaders sometimes treat RCM as a cost center and physician compensation as a separate HR issue. That split is artificial. Every denied claim, every avoidable rebill, and every delayed payment narrows the margin available for compensation.
The reverse is also true. Better RCM performance creates financial room. That room supports stronger offers, more credible incentives, and less pressure to choose between physician retention and operating stability.
Using Salary Data For Strategic Practice Benchmarking
Salary benchmarks matter most when they change decisions. For practice managers, the useful question is not whether a physician pay figure looks competitive on paper. The useful question is whether the practice can support that figure by specialty, site, payer mix, and collections performance over time.
That distinction becomes more important in multi-site groups. A statewide average can distort hiring plans if one location draws a different patient mix, contracts under different payer terms, or operates with slower collections. As noted earlier, local physician pay can vary meaningfully within the same state. A single compensation model rarely fits every market your organization serves.
A Practical Benchmarking Checklist
Practice leaders can turn salary data into an operating tool by asking:
- Are we benchmarking against the right labor market? Statewide figures are often too broad for city-based recruiting or for smaller regional sites.
- Are we comparing the right physician cohorts? Primary care, hospital-based specialties, and procedural specialties generate different revenue patterns and should not share identical compensation assumptions.
- Do collections support the compensation plan? If offers align with market expectations but margins remain tight, the issue often sits in coding accuracy, denial rates, payment lag, or payer contract performance.
- Are reporting definitions consistent across sites? Charges, net collections, work RVUs, denial categories, and days in A/R need one standard definition or comparisons become misleading.
What Good Benchmarking Looks Like In Practice
Strong benchmarking combines compensation data with operating data. That means reviewing physician pay beside payer yield, lag to payment, denial trends, and provider productivity. A practice that pays at the high end of the market can still protect margin if its claims process is clean and its net collection rate is stable. A practice with average salaries can still face retention pressure if billing friction suppresses physician collections and incentive payouts.
The reporting layer matters here. Groups with multiple locations often struggle because compensation data sits in one system, billing data in another, and physician productivity in a third. Teams working to centralize those feeds may benefit from managed IT services that support data management and analytics across distributed operations.
A disciplined benchmarking process usually includes:
- Compensation comparisons by specialty, site, and employment model
- RCM performance reviews tied to denial patterns, claim accuracy, and payment speed
- Provider onboarding metrics, including credentialing timelines and payer readiness
- Quarterly analysis of productivity against net collections, not productivity alone
Many organizations formalize that process through recurring benchmarking in healthcare so compensation planning, budgeting, and revenue planning use the same operating assumptions.
The strategic value is straightforward. Salary benchmarks are planning inputs. They show what level of financial performance a practice must produce to recruit and retain physicians without weakening cash flow, compressing margins, or relying on compensation promises the revenue cycle cannot fund.
If your practice needs help turning compensation benchmarks into a workable collections strategy, One For All Medical Billing helps healthcare organizations strengthen revenue cycle performance across coding, claims, denial follow-up, payment posting, credentialing, and analytics. For physician groups that want to support competitive pay with cleaner claims and stronger collections, that operational discipline can make the difference between reacting to the market and leading within it.

