

table of contents
Your billing team is pulling reports every week. The practice management system has dashboards. The EHR has exports. The clearinghouse has its own rejection view. Yet when cash slows down, denials climb, or one location starts underperforming, nobody can answer the question that matters most.
What changed, and what do we do next?
That's where reporting and analytics stop being an administrative task and start acting like a management tool. In medical billing, the point isn't to collect more numbers. It's to turn those numbers into decisions that protect cash flow, cut rework, and keep small issues from becoming month-end surprises.
From Data Overload To Actionable Insight
Most new practice administrators run into the same problem. They inherit plenty of reports but very little clarity. One spreadsheet shows charges, another shows payments, another shows denials, and none of them tell a coherent financial story on their own.
Raw data doesn't fix a revenue cycle. A structured review process does.
The most useful way to think about reporting and analytics is this: reporting tells you where the pressure points are, and analytics tells you which lever to pull first. Without that second step, teams fall into a familiar pattern. They review dashboards, nod at the numbers, and go back to working claims one by one without changing the underlying process.
Start With A Short Operating Cadence
If you want reports to drive action, keep the review rhythm simple:
- Check Core Revenue Cycle Signals Weekly: Look at A/R aging, first-pass performance, denials, and payment posting trends.
- Review Exceptions Before Summaries: Don't start with total collections. Start with what's stuck, rejected, or delayed.
- Assign An Owner To Every Outlier: A report without an owner becomes archive material.
- Track The Result Of The Fix: If front-end eligibility, coding edits, or payer follow-up changed, the next report should confirm whether the issue moved.
A good revenue cycle management dashboard helps because it puts those signals in one place. But the dashboard itself isn't the solution. The workflow around it is.
Practical rule: If a report can't answer who needs to act, what they need to change, and when you'll recheck the outcome, it's not operationally useful yet.
Small specialty clinics and multi-site groups both benefit from the same discipline. The difference is scale. A small clinic usually needs faster visibility into a few essential metrics. A larger group needs the same visibility, but segmented by payer, provider, location, and service line so leaders can see where performance is drifting.
What Reporting And Analytics Mean For Your Practice
Reporting is the financial health checkup. Analytics is the diagnosis.
That distinction matters because many practices still treat these terms as if they mean the same thing. They don't. Reporting gives you the visible signs. Analytics explains what caused them and what will likely happen if nothing changes.
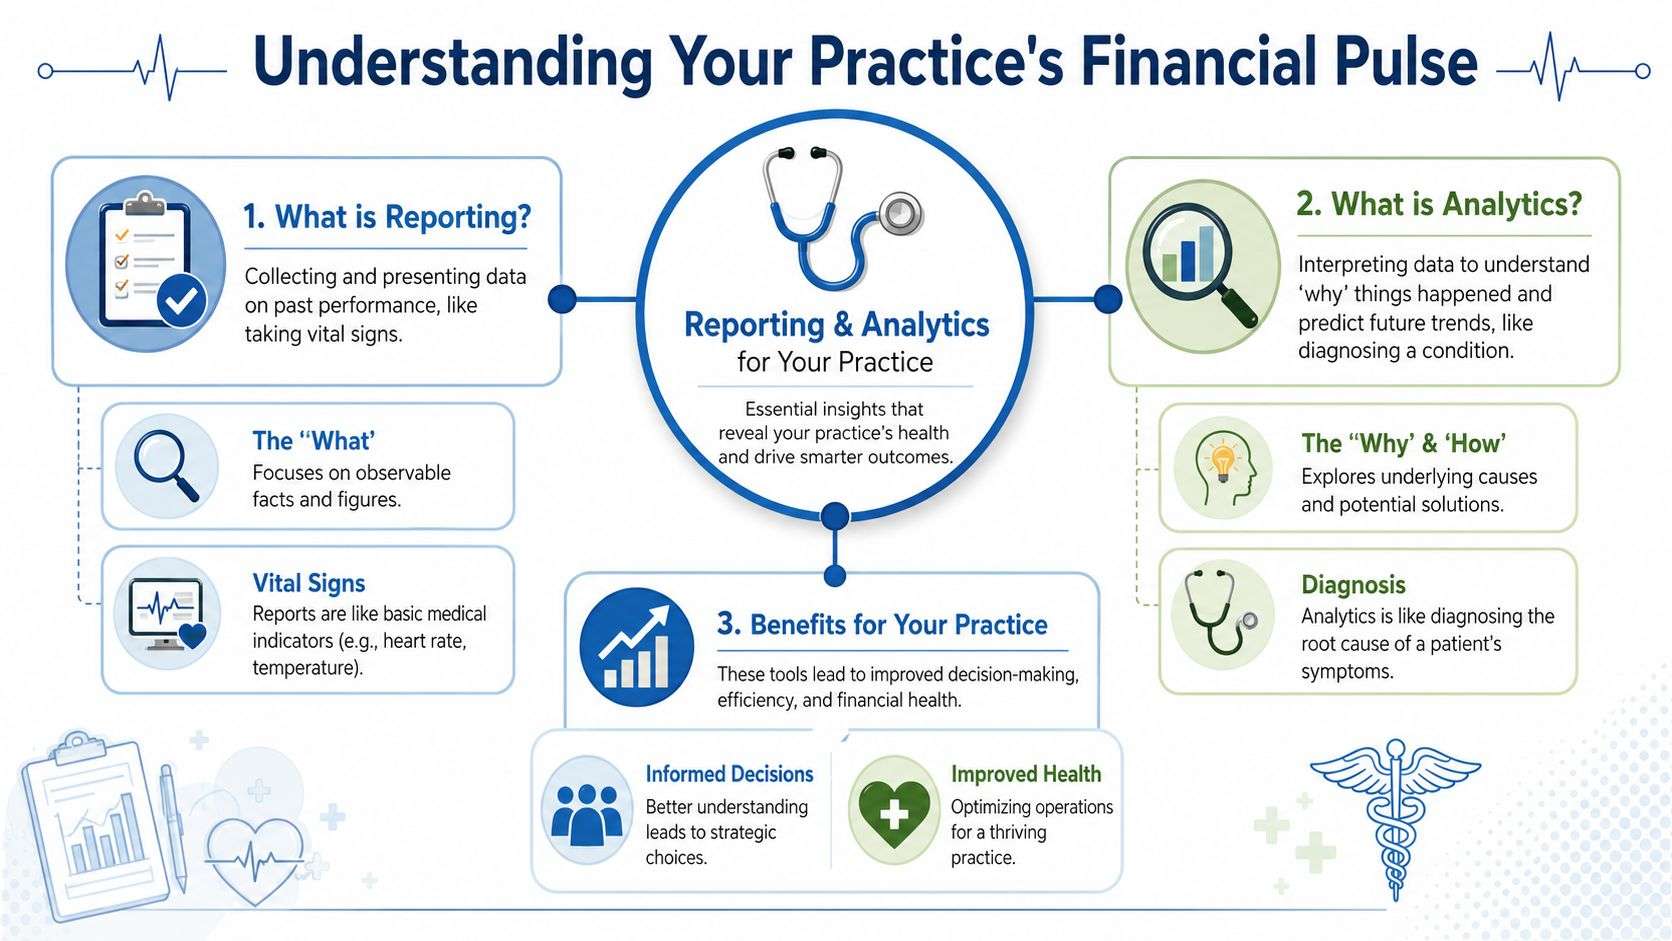
Reporting Shows The What
A report answers straightforward questions:
- What is our current A/R aging?
- What was denied this week?
- Which payer is slowest to reimburse?
- Which provider has the most edits or rejections?
That's valuable. You need the snapshot. In the same way a blood pressure reading tells a clinician whether something might be wrong, a billing report tells an administrator whether collections, coding, or claims flow need attention.
Analytics Explains The Why
Analytics starts when you stop looking at a number in isolation. If one location has older A/R than the others, analytics asks whether the issue traces back to charge lag, authorization failures, registration errors, payer-specific edits, or provider documentation habits.
That shift from static review to active interpretation is why the broader field keeps expanding. The global data analytics market is projected at USD 108.79 billion in 2026 and expected to reach USD 438.47 billion by 2031 at a 32.15% CAGR, according to Mordor Intelligence's data analytics market outlook. In healthcare, that matters because reporting alone tells you what already happened. Analytics helps you intervene before the same problem repeats.
A practical RCM approach for healthcare providers depends on both. Reports without analysis are passive. Analysis without reliable reports turns into guesswork.
Reporting answers, “What's happening?” Analytics answers, “Why is it happening, and what should we change first?”
Static Monthly Reports Aren't Enough
Month-end packets still have a role, especially for leadership and financial reconciliation. But they're too late for daily operations if they're your only view. By the time a monthly report confirms a denial trend, the front desk may have repeated the same registration error hundreds of times, or a coding issue may have already hit an entire payer class.
That's why dynamic dashboards, exception worklists, and segmented reports matter more than long PDF summaries. The useful question isn't whether you have reports. It's whether your reports help the team act while the issue is still manageable.
The Essential KPIs For Medical Billing Health
A practice can review twenty billing metrics every month and still miss the two or three that explain why cash is late. The better approach is to treat KPIs like a financial health checkup. A short set of measures tells you whether the revenue cycle is healthy, where it is straining, and which team needs to act.
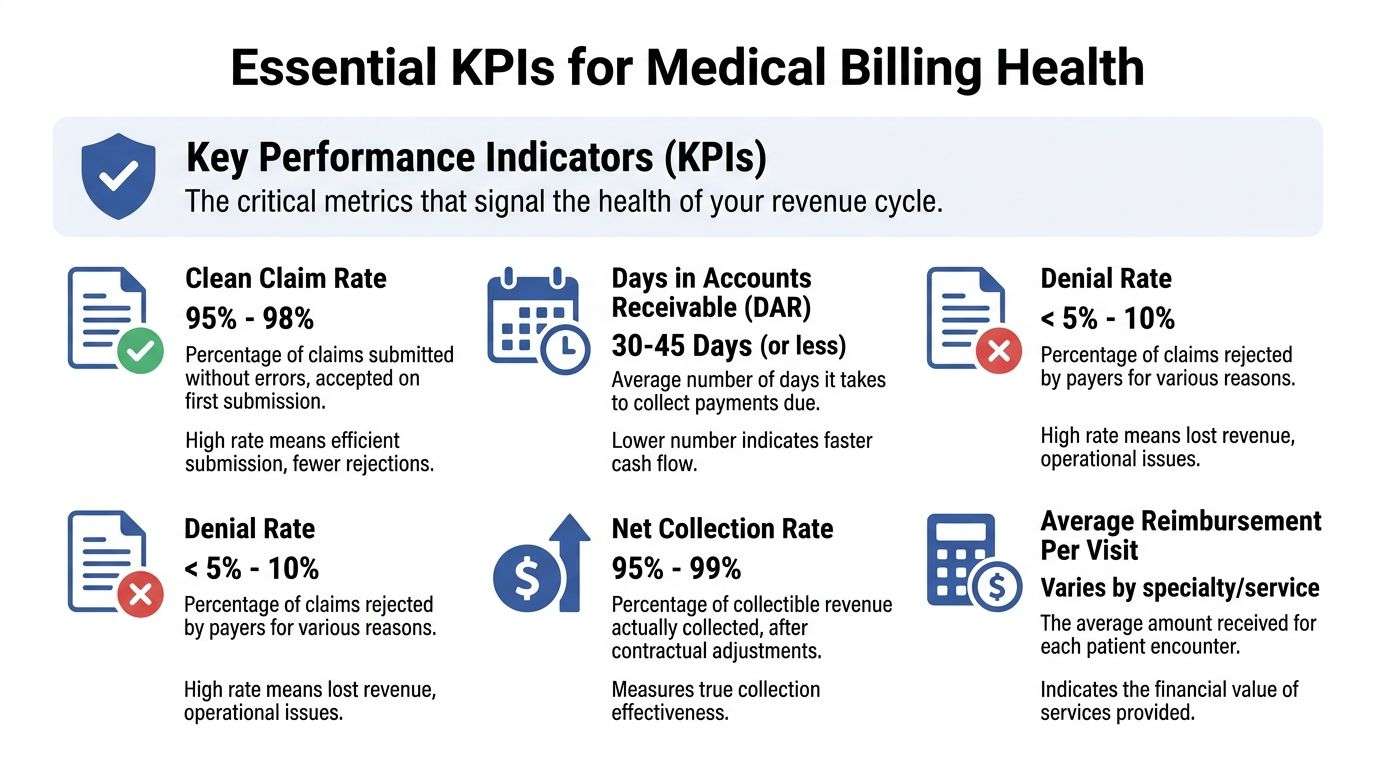
Days In Accounts Receivable
Days in A/R shows how long billed charges sit before they turn into cash. It is one of the quickest checks of billing performance, but the average alone is not enough.
Break it into age buckets such as 30, 31 to 60, 61 to 90, 91 to 120, and over 120 days. That view shows where money is getting stuck. Office Practicum's billing analytics guidance notes that clinics above 40 days in A/R often see weaker cash flow. In practice, the next question is the one that matters. Which payer, location, provider, or work queue is feeding the older buckets?
For a multi-site group, this KPI should be compared by office, not only at the enterprise level. One location with slow charge entry or weak follow-up can hide inside a blended average.
First-Pass Acceptance
First-pass acceptance measures how many claims clear on the initial submission without correction. It reflects front-desk accuracy, charge capture discipline, coding quality, and claim edit management all at once.
A drop here usually creates rework before leadership sees a denial trend on the monthly summary. If acceptance slips, trace it to a source you can assign. New staff at registration, one provider with incomplete documentation, one payer with stricter edits, or one specialty service line with frequent modifier errors.
Specialty practices should segment this metric by claim type. Surgical claims, infusion claims, and therapy claims often fail for different reasons. One blended rate can hide a specific workflow problem.
Denial Rate And Denial Mix
Denial rate gets attention because it is easy to track. Denial mix is what helps you fix the problem.
A rising denial rate only tells you that money is being delayed or lost. The mix tells you where to work. Eligibility denials point to scheduling and registration. Authorization denials point to referral management and payer rules. Coding denials point to provider documentation, coder training, or edit logic. Timely filing denials point to charge lag or weak claim hold management.
This KPI should always be reviewed by root cause, payer, and location. That is how a specialty clinic separates a prior authorization problem from a coding problem, and how a multi-site practice identifies whether one office needs coaching instead of rolling out systemwide retraining.
Net Collection Rate
Net collection rate answers a harder operational question. Are you collecting what you should collect after contractual adjustments, or are avoidable write-offs eating margin?
When this number weakens, look at underpayments, small balance write-offs, untapped secondary claims, and staff adjustment patterns. I also review payer behavior here. A low net collection rate can reflect internal follow-up gaps, but it can also expose a payer that is consistently reimbursing below contract and not getting challenged.
Average Reimbursement Per Visit
Average reimbursement per visit is not a universal benchmark. It changes by specialty, payer mix, visit complexity, and service line. It is still useful because it shows shifts that total collections can hide.
If reimbursement per visit drops in cardiology, the cause may be coding changes, payer mix movement, or a loss of higher-acuity visits. In a primary care group, it may reflect more preventive visits and fewer problem-focused encounters. The metric only becomes actionable when you compare like with like. Same specialty, same payer class, similar provider mix, similar visit types.
That is also where a disciplined healthcare benchmarking process for practice performance helps. Internal trends matter most, but outside benchmarks can confirm whether the issue is your operation or a broader market shift.
How To Use KPIs Without Getting Lost In Them
Each KPI should trigger a management action.
- For A/R Days: identify which aging bucket is growing, then assign the issue to front-end errors, claim submission delays, payer adjudication, or follow-up backlog.
- For First-Pass Acceptance: isolate the failure by office, payer, provider, and claim type so retraining is targeted.
- For Denials: separate eligibility, authorization, coding, documentation, and timely filing denials so the right team owns the correction.
- For Net Collection Rate: review write-offs, underpayments, and secondary billing performance before assuming the problem is collections effort.
- For Reimbursement Per Visit: compare within the same specialty and payer class before drawing conclusions.
KPIs are useful when they lead to a specific decision. If the metric does not tell a practice what to review, who should own it, and what should change this week, it is just another number on a dashboard.
Key Reports That Tell Your Financial Story
A practice can post strong charges for the month and still feel cash pressure by payroll week. The difference usually shows up in the reports. Good reporting works like a financial health checkup. It shows where cash is slowing down, where work is getting stuck, and which part of the operation needs attention first.

The A R Aging Report
The aging report shows how long money has been sitting uncollected. For a practice administrator, it is one of the fastest ways to separate a temporary delay from a real collections problem.
Use it by payer, location, and financial class, not just as one rolled-up total. A multi-site primary care group may find one office has a front-desk eligibility issue driving self-pay balances, while a specialty clinic may see one payer stacking claims into the 61 to 90 day bucket because of authorization edits. Those are different problems and need different fixes.
Older balances also need a different workflow than fresh claims. Teams should not spend the same effort on a 10-day claim scrub issue and a 120-day underpayment appeal. If your staff cannot define aging priorities clearly, start with a tighter review of accounts receivable days calculation so the team is measuring delay the same way.
The Denial Analysis Report
A denial report is useful only if it points to ownership. Sort denials by reason code, payer, provider, location, and service line. Then assign each category to the team that can prevent it.
I see this mistake often. Everything gets routed to billing, even when the denial started at scheduling, registration, authorization, or documentation. Billing can rework the claim, but repeated denials stay in place until the source process changes.
One pattern matters more than the raw count. Repeat denials by the same reason.
That pattern usually tells you where to act. In orthopedics, it may be prior authorization gaps on imaging or injections. In behavioral health, it may be eligibility drift or visit limit issues. In a multi-site group, one office can create most of the denial volume because one registrar or one local workflow is off standard.
The Procedure Code Analysis
This report checks whether the services performed, documented, coded, and paid all line up. It is one of the best reports for finding quiet revenue loss that does not stand out on a high-level dashboard.
As noted in iMed Claims' overview of medical billing reports, procedure-level reporting helps uncover coding mismatches, missed charge capture, and payment variance. The practical value is not the definition of the report. It is what the report lets a manager do next.
For specialty practices, this matters even more. Gastroenterology, cardiology, pain management, and surgical groups often have modifier, bundling, and medical necessity patterns that general summary reports miss. A code analysis should answer questions like these: Which high-volume CPTs are getting denied most often, which provider has the widest reimbursement variance, and which location is consistently undercoding or missing ancillary charges?
The Payer Mix And Financial Reports
Payer mix reports show where revenue concentration creates risk. Financial reports show whether that risk is already affecting cash, write-offs, or margin.
Read them together. If one payer accounts for a large share of revenue, even a small change in edit rules, authorization requirements, or payment timing can hit the practice hard. A specialty clinic with heavy Medicare Advantage volume has a different exposure than a multi-site pediatric group dominated by Medicaid managed care. The action plan should reflect that.
I usually want administrators to ask three direct questions when they review these reports: Did our payer composition change, did payment behavior change, and did our write-offs change? If the answer is yes to any of the three, total charges alone will give a false sense of security.
How To Read And Act On Your RCM Reports
Good reporting doesn't change anything by itself. Action does. The most reliable method I've used is a simple four-step routine that keeps teams from jumping straight to assumptions.
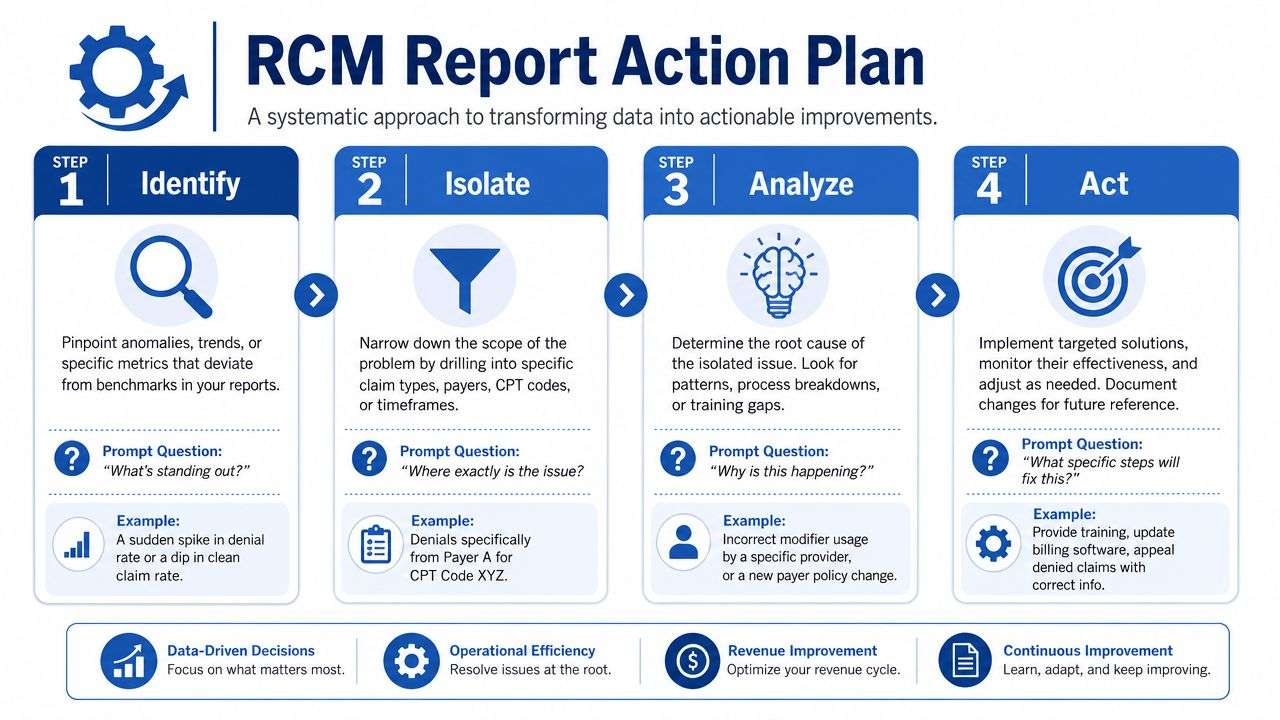
Identify
Start with what's visibly off. That could be an unusual aging spike, a sudden payer slowdown, or a provider whose denials are climbing faster than everyone else's.
The key is to resist broad conclusions too early. “Collections are down” isn't a useful finding. “The 61 to 90 day bucket grew after claims from one payer began rejecting a specific modifier combination” is useful.
Isolate
Once you spot a problem, narrow it. Segment by payer, CPT code, location, rendering provider, denial reason, or date range until the pattern tightens.
Here are common ways to isolate an issue:
- By Payer: Useful when reimbursement timing or edits changed.
- By Provider: Helpful when documentation or charge capture habits vary.
- By Code Set: Important for specialty services, modifiers, and medical necessity patterns.
- By Site: Necessary in multi-location groups where one office may have a front-desk or workflow problem others don't.
Analyze
This is the root-cause step. You're no longer asking what moved. You're asking why it moved.
If the aging report shows growth in one bucket, look backward through the workflow. Was the provider newly credentialed? Did authorization rules change? Did a registration field start populating incorrectly? Did coders begin using a different diagnosis pairing? Did staff training slip after a workflow change?
Field note: Most recurring denial patterns come from a small number of repeatable causes. Find the repeatable cause, and you reduce rework faster than by chasing claim volume alone.
Act
The fix should match the cause. Not every problem belongs to the billing office.
A few examples:
- Registration Errors: Update front-desk scripts and eligibility verification checkpoints.
- Coding Drift: Build payer-specific edits, refresh coding guidance, and review rejected claims by provider.
- Authorization Gaps: Add scheduler prompts and escalation rules for missing approvals.
- Documentation Issues: Give providers specific feedback tied to the denied claim pattern, not generic reminders.
Formal feedback matters here. The PubMed-indexed review on billing education and corrective systems found that implementing a formal feedback and corrective system alongside educational components is positively correlated with increased billing accuracy and revenue. In practice, that means review meetings should end with corrected workflows, accountable owners, and targeted education, not just circulated reports.
Monitor
After the fix, recheck the same report and the same segment. If you changed the workflow but your report design also changed, you won't know whether the process improved or the view shifted.
However, many teams break the chain at this point. They identify and discuss, then move on. Monitoring is what turns analytics into operations.
Advanced Analytics For Multi-Site And Specialty Clinics
Complex organizations need more than a top-line dashboard. A multi-site group can look healthy overall while one location drags down cash flow. A specialty clinic can post solid collections while losing margin through authorization friction or code-level denials hidden inside a broad average.
What Multi-Site Leaders Should Segment
For multi-site practices, the first rule is simple. Don't manage by blended totals alone.
Compare sites by workflow stage, not just by final collections. One location may register patients cleanly but lag in charge entry. Another may submit quickly but produce more denials tied to local staffing habits. The only fair comparison is one that looks at the same measures across the same time window and the same payer mix as closely as possible.
Useful segmentation often includes:
- Location-Level Performance: Watch aging patterns, denial categories, and posting lag by site.
- Provider Variance Within Each Site: Separate site issues from individual documentation or coding habits.
- Payer Behavior By Geography: Regional payer dynamics can distort a site comparison if you don't account for them.
- Shared Best Practices: When one office consistently avoids a denial pattern, document exactly what staff there are doing differently.
What Specialty Clinics Should Track More Closely
Specialty groups need reporting and analytics tied to the codes and payer rules that drive revenue. Generic billing summaries usually miss the operational details that matter most.
For specialty operations, I'd focus on:
- Procedure Code Utilization: Look for underused, overused, or frequently denied codes by provider.
- Authorization Patterns: Flag repeated delays or denials tied to a narrow set of payers or services.
- Modifier Use And Documentation Support: Specialty reimbursement often depends on details that broad monthly reporting hides.
Data quality matters even more in these environments. If the EHR, practice management system, and clearinghouse don't align, your analysis will point people in the wrong direction. Garbage in, garbage out is still the rule.
A more advanced workflow can also support better operational equity. Wavetec's discussion of healthcare analytics and inequities notes a critical gap between generating reports and using them for equity-driven change. Few providers integrate demographic insights with financial data to identify and reduce access disparities. That matters in real operations. If certain patient groups face more scheduling friction, longer authorization delays, or higher balance-related drop-off, your revenue data is already showing you part of the access problem. Pairing those patterns with tools such as AI in revenue cycle management can help organizations move from broad summaries to targeted decisions about staffing, scheduling, and follow-up.
Building A Proactive Revenue Cycle With Smart Analytics
The strongest revenue cycle teams don't wait for month-end pain to confirm there's a problem. They use reporting and analytics as a financial GPS. Not just a rearview mirror.
That means watching the right KPIs, reading the reports behind them, isolating the cause of changes, and assigning fixes to the right part of the workflow. It also means treating multi-site and specialty complexity as something to segment, not something to average away.
When practices do this well, reporting stops being a pile of exports and starts becoming a management discipline. That's when cash flow gets steadier, denial work gets more focused, and leadership can make decisions before small breakdowns spread across the operation.
Your data is already talking. The question is whether your team is using it to react late or steer early.
If your practice needs help turning billing data into action, One For All Medical Billing can support the full revenue cycle with U.S.-based billing and coding expertise, denial and A/R follow-up, reporting and analytics, credentialing support, and specialty-aware workflows for independent clinics, urgent care centers, multi-site groups, and health systems. The right partner doesn't just send reports. They help you use them to get paid faster, reduce denials, and run a calmer operation.

